

Your IQ percentile by country is the share of that nation's population scoring at or below your result on a given IQ test. Most tests assume a mean of 100 and a standard deviation of 15, so a score of 120 lands you around the 91st percentile in a population that matches those norms. Before trusting any percentile, confirm your test's standard deviation and work through the conversion example below.
TL;DR:
- IQ percentiles vary significantly depending on the test's standard deviation and how the norm sample was constructed; always verify these details before interpreting results.
- Small score differences near the mean can cause large percentile shifts, while the same score differences at the extremes result in minimal percentile changes.
- The standard error of measurement means that scores within a few points or percentiles should be considered statistically similar, not precisely different.
- Country-specific percentiles depend on the representativeness of the norm sample, with biases possible from demographic, linguistic, or cultural factors in the test.
- Using an online platform that provides real-time percentile and subtest details offers a more accurate understanding of your IQ score than relying solely on raw or simplified results.
Table of Contents
- How Are IQ Percentiles Calculated?
- Why Standard Deviation and Test Norming Change Your Percentile
- How Precise Is Your Percentile, Really?
- Why a Country-Specific Percentile Comes With Caveats
- Step-by-Step: Converting Your IQ Score to a Percentile
- What Your Percentile Means and What to Do Next
- An Editor's Take on Using Your Score Wisely
- Get Your Country-Aware Percentile With Testuno
- Sources
- FAQ
How Are IQ Percentiles Calculated?
IQ scores are built on a bell curve, the normal distribution, with 100 set as the midpoint. That means half of any properly normed population scores below 100 and half above it. The percentile just answers one question: what fraction of people fall at or under your number?
The standard deviation controls how fast percentiles shift as scores rise. With the common SD of 15, roughly 68% of people score between 85 and 115, 95% fall between 70 and 130, and 99.7% land between 55 and 145. That structure explains why percentile movement isn't steady across the scale:
- Near the mean, small point changes swing percentiles hard. Going from 100 to 105 might jump you from the 50th to the 63rd percentile.
- Near the extremes, the same five points barely move the needle, since so few people occupy that territory to begin with.
- A jump from 140 to 145 changes your percentile by a fraction of a point, even though it feels like the same five point gain.
This nonlinearity is the reason two people with a 10 point gap near the mean feel more different, statistically, than two people with a 10 point gap way out on the tail.
Why Standard Deviation and Test Norming Change Your Percentile
The same raw score of 130 can mean different things depending on which test produced it. Most IQ tests use SD 15, but some, including certain versions of the Cattell test, use SD 16. That difference sounds small, yet it reshuffles where a given score lands on the percentile curve. Calculators built around SD 15 will misplace your percentile if your test actually norms on SD 16.
Then there's norming itself: the process of testing a large, representative sample to establish what "average" looks like for a given population. A country-specific percentile only means something if the norm sample actually reflects that country's demographics.
Before converting your score, check a few things:
- Look up your test's technical manual or FAQ for its stated mean and SD.
- Confirm whether the norm sample is national, regional, or an international convenience sample.
- Note the year the norms were collected. Older norms drift as populations change over generations, a pattern researchers call the Flynn effect.
Skipping this step is the single most common reason people misread their own results.
How Precise Is Your Percentile, Really?
Every IQ score carries a margin of error called the standard error of measurement, or SEM. A single test session gives you an estimate, not a fixed truth, and that estimate wobbles by several points depending on the test's reliability.
Practically, this means two scores that differ by a handful of points might not represent a real difference in ability at all. If your raw score is 118 and a friend's is 122, treat that four point gap as noise until proven otherwise, not as evidence one of you is meaningfully sharper. Percentile bands work the same way. A percentile of 84 and one of 89 sit close enough that they may reflect the same underlying ability, just captured on different days or under different conditions.
Anyone sitting right at a meaningful cutoff, gifted program eligibility, for instance, should treat that number as a range, not a hard line. If your score matters for a real decision, consider retesting or reviewing your subtest pattern before drawing conclusions from a single sitting.
Why a Country-Specific Percentile Comes With Caveats
Turning a raw IQ score into a country-level percentile requires a norm sample that actually represents that country's population, and that's harder to pull off than it sounds. Age distribution, education levels, and urban versus rural composition all shape what "average" looks like in the sample. A norm group skewed toward university students in a capital city will not represent the national population, and any percentile built on it will run high.
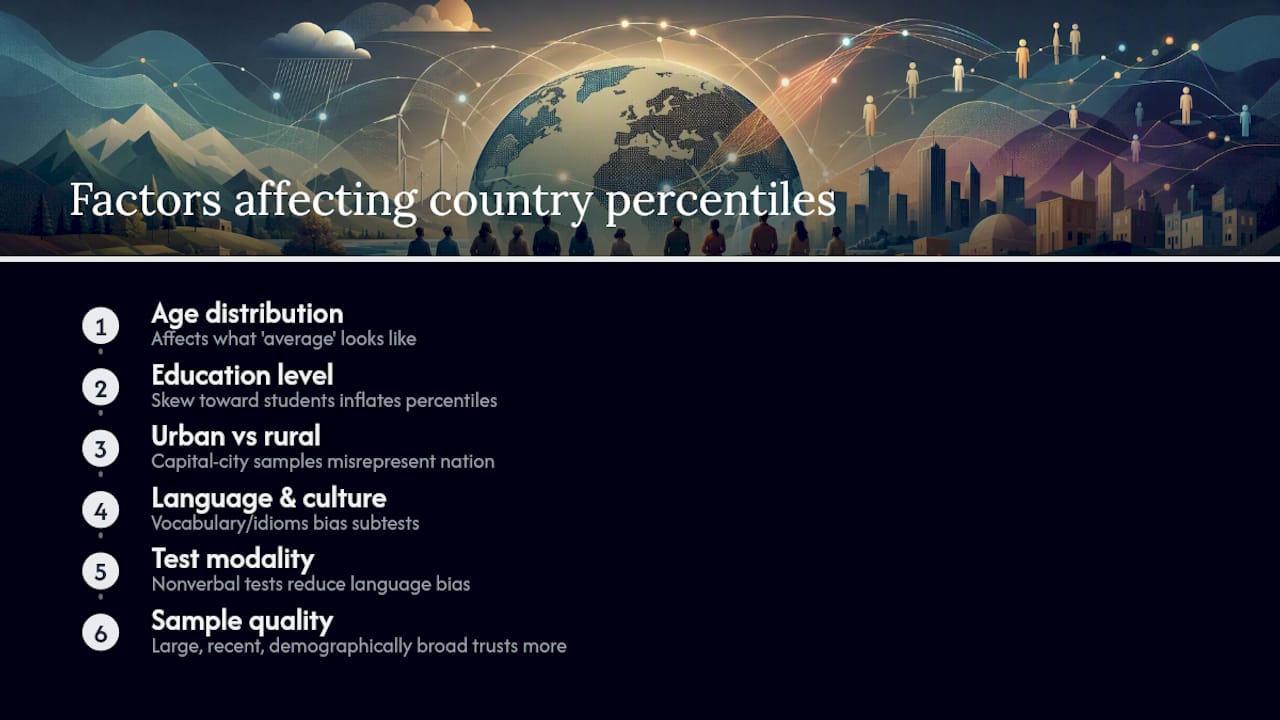
Language and cultural content inside subtests add another layer of distortion. Vocabulary items, idioms, and culturally specific reasoning puzzles can penalize test takers whose first language or educational background differs from the norm group, even when their underlying reasoning ability is identical. This is part of why psychometric researchers caution against treating a single online score as a precise national percentile without checking how the sample was built.
A nonverbal IQ test sidesteps some of this by leaning on pattern recognition and spatial logic instead of vocabulary or cultural references, which makes it a useful cross-check if you suspect language bias inflated or deflated your score. As a rule, a country percentile deserves more trust when the underlying norm sample is large, recent, and demographically broad. Treat anything built on a small or dated sample as a rough approximation, useful for orientation, not for precision.
Step-by-Step: Converting Your IQ Score to a Percentile
Here's the actual process, laid out so you can do it in under a minute.
- Confirm your test's mean and SD. Most tests use mean 100, SD 15. If your results page doesn't state the SD, assume 15, since that is the industry default.
- Calculate your z-score. Subtract 100 from your score, then divide by the SD. A score of 125 with SD 15 gives you a z-score of 1.67.
- Convert the z-score to a percentile. You can look this up on a standard normal table, or just plug your score into an IQ percentile calculator built for SD 15.
- Check your result against a reference table for a sanity check before you draw any conclusions.
An IQ of 125 on an SD 15 scale converts to roughly the 95th percentile, meaning you scored higher than about 95 out of 100 people in a matching norm sample.
Here's a quick lookup table for common scores on the standard SD 15 scale:
| IQ Score | Approximate Percentile |
|---|---|
| 100 | 50th |
| — | 95th |
| 120 | 91st |
| 125 | 95th |
| 130 | 98th |
| 140 | 99.7th |
| 145 | Above 99.7th |
These figures come from standard SD 15 percentile mappings and apply to a population that matches the norm sample's age and demographic profile.
What Your Percentile Means and What to Do Next
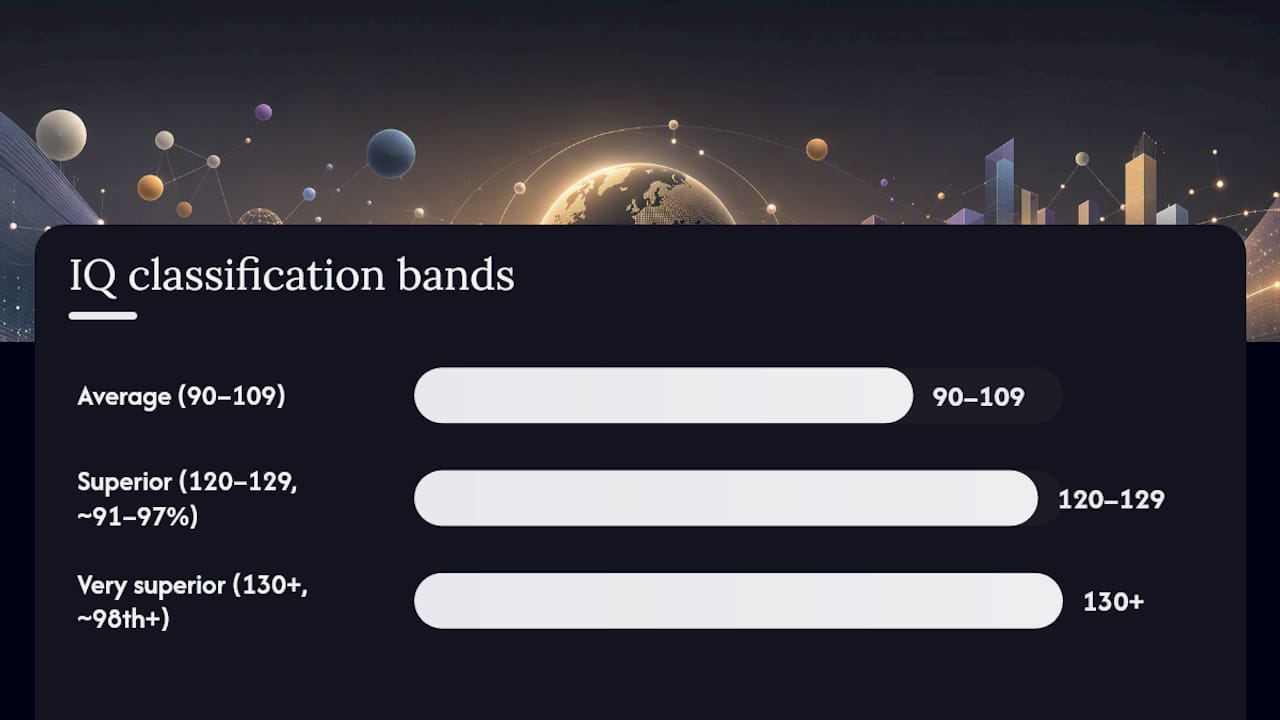
Classification labels give you a rough vocabulary for talking about scores, but they're guardrails, not verdicts. Under common frameworks, 90 to 109 falls in the "average" band, 120 to 129 lands in "superior" territory around the 91st to 97th percentile, and 130 and above marks the "very superior" range near the 98th percentile and up.
A few practical rules for using this well:
- Don't fixate on the exact percentile number if it sits near a band boundary. The SEM discussed earlier means you could genuinely belong in either category.
- Look at your subtest breakdown before drawing conclusions from a single composite score. A cognitive profile that shows strong verbal reasoning but weak processing speed tells you more than a single number ever could.
- Retest only if you have a specific reason to suspect the first result was compromised by fatigue, distraction, or unfamiliarity with the format.
This is exactly where a platform like Testuno adds value beyond a bare number: its IQ test pairs your estimated score with subtest-level detail and real-time percentile benchmarking, so you're not left guessing what a single figure means for your actual cognitive profile.
An Editor's Take on Using Your Score Wisely
The obsession with a single IQ number misses the point. A percentile tells you where you land relative to a specific population, nothing more, and that population's makeup can shift the answer more than most people realize.
What actually matters is the pattern underneath: where your reasoning is strong, where it lags, and what that means for how you learn or work. Chase the profile, not the label. Testuno's subtest reports exist for exactly that reason.
— Steve
Get Your Country-Aware Percentile With Testuno
An online platform is a direct option for readers who want their percentile without the guesswork of tracking down calculators and norm tables themselves. The Full IQ Estimate runs through six research-grounded subtests and returns real-time percentile benchmarking alongside a downloadable report, so you see exactly where your score sits and which cognitive areas drove it.
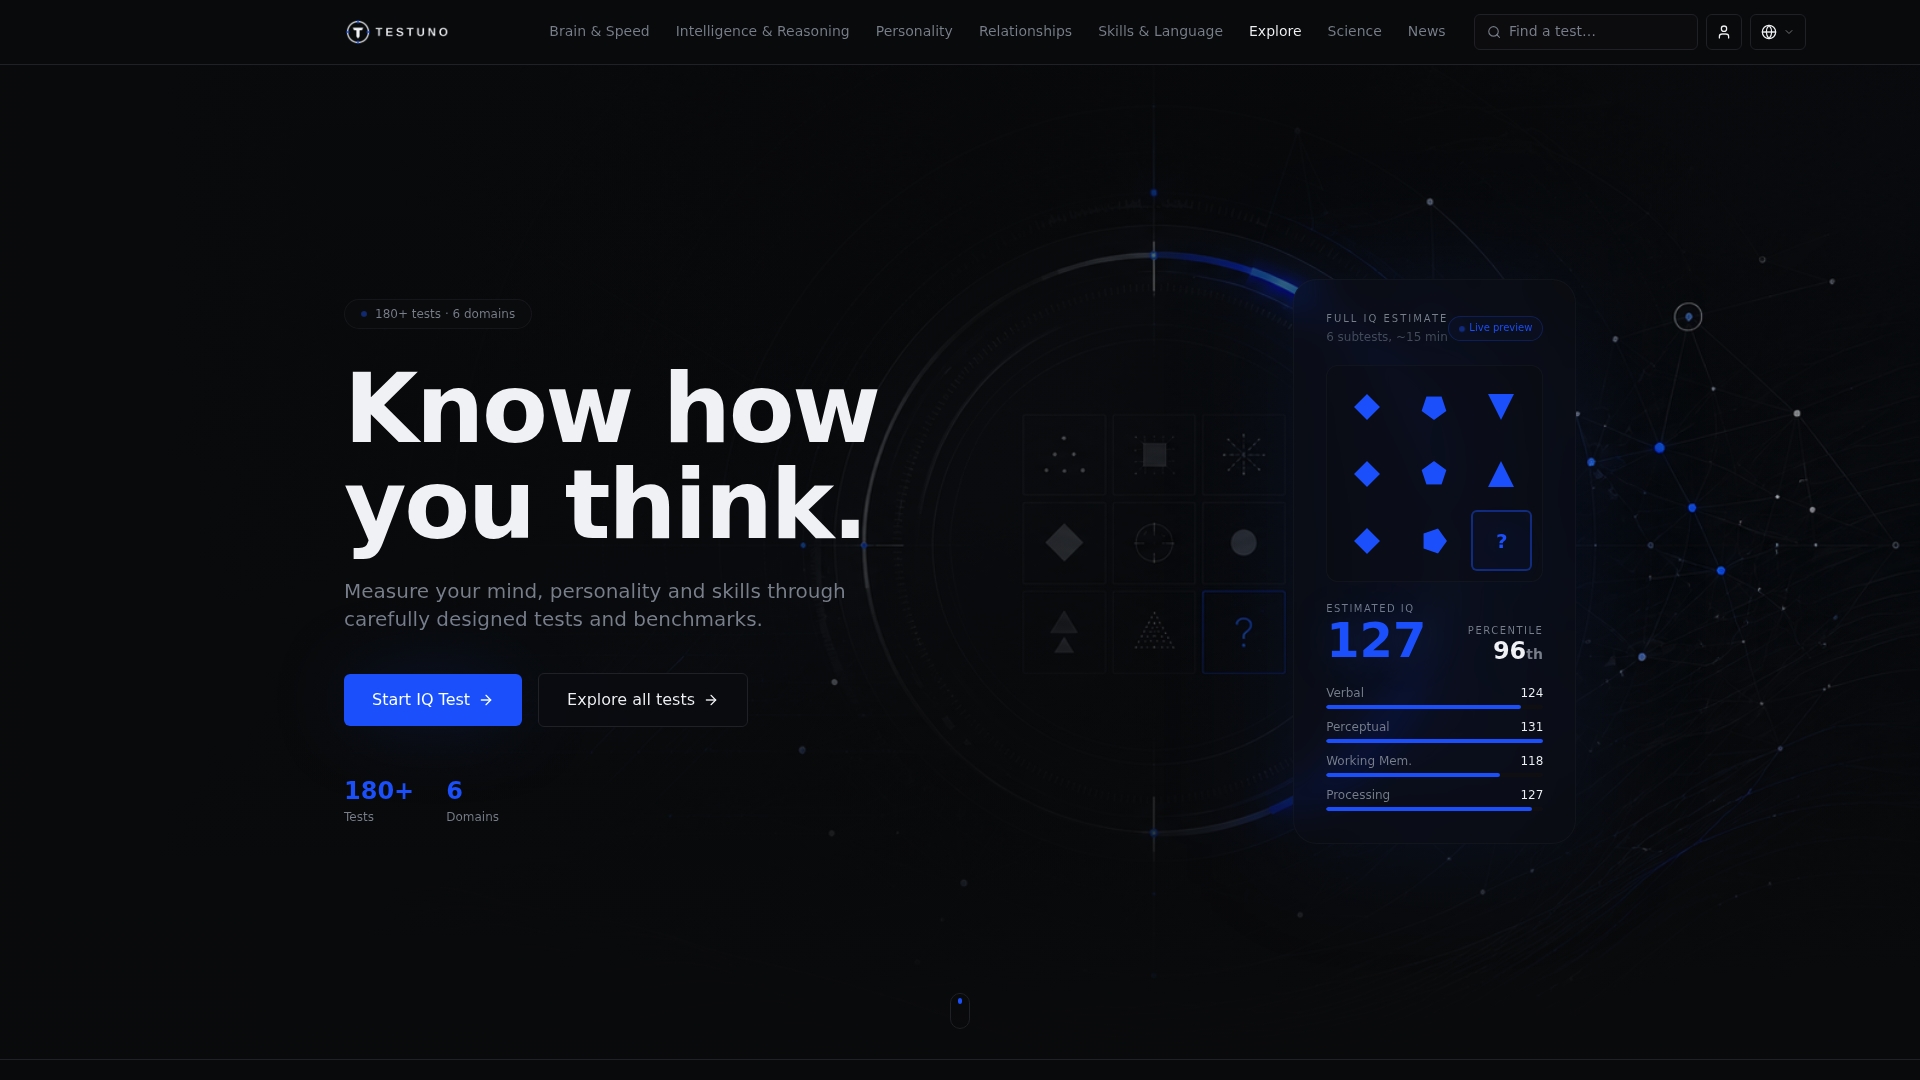
That combination solves the core problem this article has been walking through: a raw score means little without context, and context means knowing both your percentile and the subtest pattern behind it. If you want a faster checkpoint first, the quick IQ test gets you a ballpark estimate in a few minutes. For the full picture, head to the IQ test page and start your assessment. No sign-up required, and results appear in about 15 minutes.
Sources
FAQ
What Does an IQ Percentile by Country Mean?
It's the percentage of a country's population that scores at or below your IQ result, assuming both your score and the country's norm sample use comparable scales. A score of 120 on an SD 15 scale corresponds to roughly the 91st percentile in a matching population.
Why Do Two Tests Give Me Different Percentiles for the Same Score?
Tests differ in standard deviation and in how their norm samples were built, so identical raw scores can map to different percentiles. Always check whether your test uses SD 15 or SD 16 before comparing results across platforms.
How Accurate Is a Single IQ Test Score?
No single sitting gives you a perfectly precise number, because of measurement error, or SEM, built into every test. Scores within a few points of each other, or near a classification cutoff, should be treated as statistically similar rather than meaningfully different.
Can I Get My Percentile Without Taking a Full IQ Test?
Testuno's quick IQ test gives a faster estimate for a general checkpoint, while the Full IQ Estimate provides complete subtest breakdowns and detailed percentile benchmarking. Both run without sign-up and return results in minutes.
Does Language Affect My Country-Specific Percentile?
Yes, subtests involving vocabulary or cultural references can disadvantage test takers whose background differs from the norm sample. A nonverbal IQ test reduces that risk by relying on pattern and spatial reasoning instead of language-based items.