

An IQ percentile chart converts a numerical IQ score, usually scaled to a mean of 100 and a standard deviation of 15, into a percentile showing where you fall against the general population. Percentile rank, not the raw number, is the metric worth trusting because it stays meaningful across tests with different scales. A score of 115 and a percentile of 84 say the same thing, but only the percentile compares cleanly if your next test uses a different standard deviation.
TL;DR:
- Percentile ranks provide a more consistent comparison across different IQ tests than raw scores, especially when scales use varying standard deviations.
- Calculating your percentile involves converting your IQ score into a z-score and then referencing the normal distribution's cumulative function.
- An IQ of 130 corresponds to roughly the 98th percentile, placing fewer than 2 in 100 people in that high range, but small score differences near cutoffs can be misleading.
- Scores near classification boundaries should be viewed as ranges due to measurement error and confidence intervals, not fixed points.
- Self-assessment tools like Testuno can estimate your IQ and percentile quickly, but formal clinical tests remain essential for significant decisions.
Table of Contents
- 1. Full IQ-to-percentile table by standard deviation
- 2. How do you calculate an IQ percentile yourself?
- 3. What do the classification bands and top percentiles mean?
- 4. Why percentile tables come with statistical limits
- 5. How Testuno reports your percentile and what it tells you
- 6. Reading percentiles without turning them into labels
- 7. Get your own IQ estimate and percentile in minutes
- Sources
- FAQ
1. Full IQ-to-percentile table by standard deviation
This table uses the most common norming convention, mean of 100 and standard deviation of 15, the scale behind the Wechsler tests. The z-score shows how many standard deviations a score sits from the mean, the percentile shows the share of the population scoring at or below it, and the rarity column reframes that percentile as a one-in-X figure.
These figures follow the standard normal distribution applied to a mean of 100 and a standard deviation of 15. If your test report uses a different standard deviation, such as 16 or 24 on some older scales, the same percentile corresponds to a different raw IQ number. A percentile of 98 sits at roughly 130 on an SD=15 scale but closer to 148 on a Cattell-style SD=24 scale, which is why Mensa's own guidance treats percentile, not raw score, as the number that actually transfers between tests.

2. How do you calculate an IQ percentile yourself?
The math behind every cell in that table is a single conversion: turn the IQ into a z-score, then convert the z-score into a percentile using the normal distribution's cumulative function.
- Subtract the mean from your score: z = (IQ − mean) / SD. For an IQ of 125 on an SD=15 scale, z = (125 − 100) / 15 = 1.67.
- Feed that z-score into the normal cumulative distribution function, which returns the share of the population below it. A z of 1.67 returns about the 95th percentile.
- Adjust the SD input if your test uses a different scale: common presets are 15 (Wechsler and most modern tests), 16 (older Stanford-Binet editions), and 24 (some legacy scales).
- Read the output as a population comparison, not a precision instrument: a percentile calculator built on this formula gives a quick estimate, but it assumes your raw score is error-free.
A calculator built this way lets you plug in scores from any test, as long as you know the mean and standard deviation it uses, and get a consistent percentile back.
3. What do the classification bands and top percentiles mean?
Classification labels exist to translate a number into a plain description, and most psychologists still use a version of the Wechsler bands:
- 70 and below: extremely low, often the threshold used in clinical and educational evaluations.
- 80 to 89: low average, below typical range but not flagged as impaired.
- 90 to 109: average, where roughly the middle half of the population falls.
- 110 to 119: high average, noticeably above typical but not exceptional.
- 120 to 129: superior, a band that already places someone ahead of the large majority of test-takers.
- 130 and above: very superior, the band most high-IQ societies use as an entry threshold.
An IQ of 115 lands at about the 84th percentile, and an IQ of 130 lands at about the 98th, meaning fewer than 2 in 100 people score that high on an SD=15 test.
That 98th percentile threshold is not arbitrary. Mensa International sets its membership cutoff at the top 2% of the general population, which works out to roughly 130 on a Wechsler-style SD=15 test but closer to 148 on some other scales, since the percentile stays fixed while the numeric cutoff shifts with the test's standard deviation. Treat any single-point score near these boundaries with some caution: a person scoring 128 and another scoring 132 are closer in actual ability than the ten-point gap between "superior" and "very superior" might suggest.
4. Why percentile tables come with statistical limits
A percentile table only works if you know what the underlying test assumed, and two caveats matter more than people expect. First, standard deviation choice changes everything: a raw IQ of 140 means something different on an SD=15 test than on an SD=24 test, because the percentile, not the number, is the constant. Second, no test score is exact.
- Scores carry measurement error, so professionals report a confidence interval around a result rather than treating it as a fixed point, a practice detailed in clinical assessment literature.
- Extreme scores, both very high and very low, are statistically less stable, since test error tends to grow as you move away from the mean.
- Clinicians look at subtest patterns and overall profile coherence rather than a single composite number, using methods such as Monte Carlo simulation to judge whether a score pattern is unusual or simply within normal variation.
Pro Tip: Treat any score within about 5 points of a classification boundary as a range, not a verdict, since confidence intervals routinely span that much.
5. How Testuno reports your percentile and what it tells you
Testuno's flagship IQ test measures performance across six research-grounded subtests and returns an estimated IQ alongside a detailed percentile ranking, built so you can see where you land against the same mean of 100 and standard deviation of 15 used in the table above. The report includes a subtest breakdown, so a strong working memory score next to a weaker processing speed score shows up as a pattern rather than disappearing into one composite number. Results come back in a short time without requiring signup. An online estimate like this is useful for self-insight and benchmarking, but it is not a substitute for a formal clinical assessment when a decision carries real stakes such as a diagnosis or educational placement. For that, a licensed psychologist administering a standardized instrument is the right next step.

6. Reading percentiles without turning them into labels
A percentile is a snapshot, not an identity. I'd treat any chart like this one as a starting point for curiosity rather than a verdict on someone's worth or potential, and I'd push back on anyone who uses a single score to close off a conversation instead of opening one. When something matters, a degree, a diagnosis, a placement decision, a formal assessment from a qualified professional beats any online tool, including this chart.
— Steve
7. Get your own IQ estimate and percentile in minutes
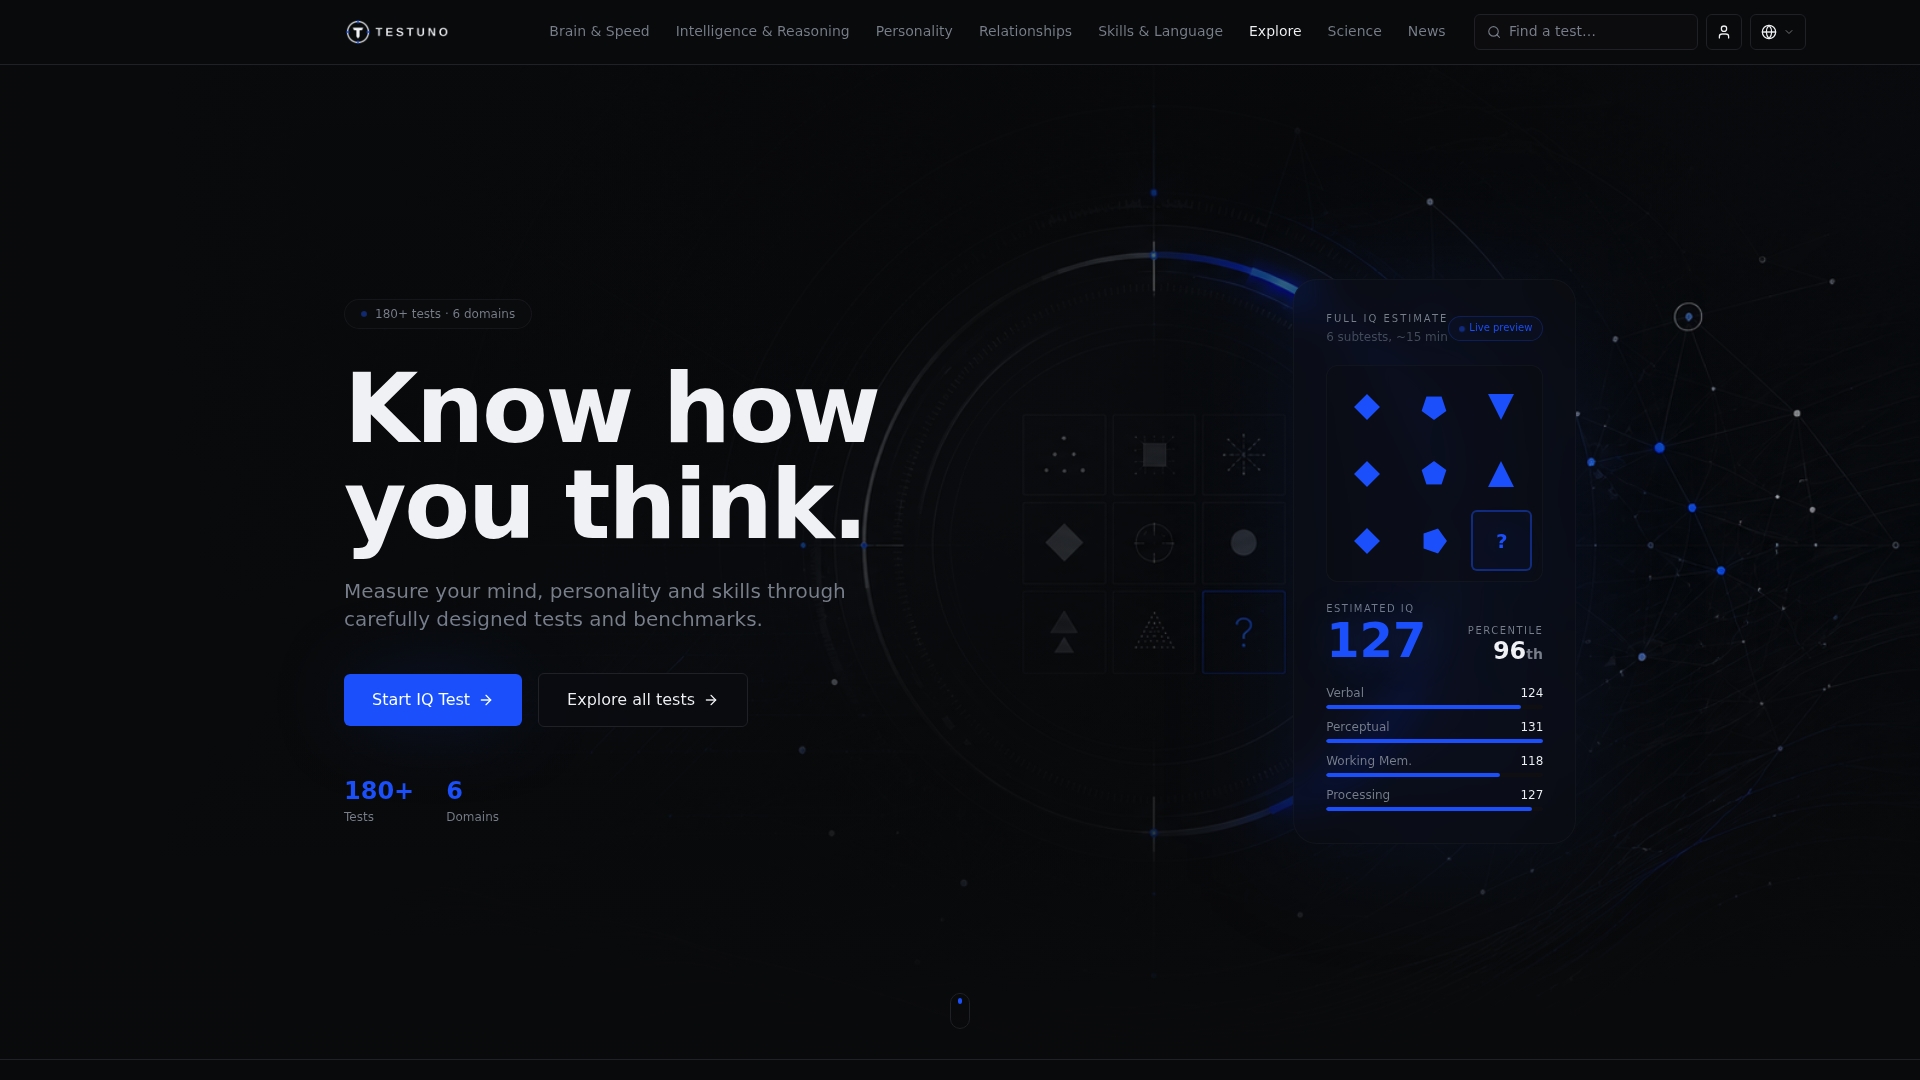
Looking up a percentile is useful, but seeing your own number is more useful. Testuno's quick IQ test gives you an estimated score and where it falls on the percentile scale in about 15 minutes, no signup required, so you can compare your result against the table above right away.
| Step | What happens |
|---|---|
| Take the quick estimate | Answer the subtest items at testuno.app |
| View your result | See your estimated IQ and percentile snapshot |
| Go deeper | Unlock a full report with subtest breakdown if you want more detail |
This is a self-assessment tool for insight and comparison, not a diagnostic clinical exam. Start at Testuno when you are ready to see where you land.
Sources
- Psychometric methods for evaluating abnormal scores and profile coherence (APA PsycNET)
- Assessment reliability and norming considerations (PMC)
FAQ
Is a 120 IQ a high IQ?
An IQ of 120 falls at about the 91st percentile on a standard SD=15 scale, placing it in the superior range and ahead of roughly 9 in 10 people. It is well above average but below the 98th-percentile threshold that high-IQ societies typically use as a cutoff.
What IQ is top 1%?
The exact number shifts if a test uses a different standard deviation, since percentile rank, not raw score, is what actually marks the cutoff.
What is Goldie Hawn's IQ?
There is no publicly verified, test-sourced IQ figure for Goldie Hawn. Any number circulating online for a public figure without a cited formal assessment should be treated as unverified.
What is Donald Trump's IQ?
There is no publicly verified, test-sourced IQ figure for Donald Trump. Claims about a named individual's IQ carry weight only when tied to a documented formal assessment, which is not publicly available here.
How do I find my own IQ percentile?
Convert your score to a z-score using z = (IQ − mean) / SD, then look up that z-score against the normal distribution to get a percentile, or use the table above directly if your test is scaled to SD=15. Testuno's quick IQ test also returns an estimated percentile directly alongside your score.