

Percentile rank tells you the percentage of people in a comparison group you scored as well as or better than, not the percentage of questions you got right. A percentile rank of 75 means you outperformed or tied 75% of the norm group, with the remaining 25% scoring higher. Ties get split down the middle using a midpoint calculation, which is why the formula looks a little more technical than the plain-English version suggests.
TL;DR:
- Percentile rank indicates how a score compares to others, with a 75th percentile meaning outperformance or equality with 75% of the group.
- The calculation of percentile rank adjusts for tied scores using a midpoint method, which gives fairer positioning among groups with many identical scores.
- Percentile ranks are useful for showing relative standing but should not be used alone for tracking growth or absolute performance, which are better reflected by raw scores or scaled scores.
- Different software may use varied methods to compute percentile rank, potentially affecting result consistency near the distribution tails.
- A percentile rank of 95 signifies being in the top 5%, while a 70th percentile reflects outperforming about 70% of peers, both subject to confidence ranges.
Table of Contents
- Percentile Rank Meaning vs. Percentile and Percent-Correct
- How to Calculate Percentile Rank Step by Step
- What 95th, 75th, and 70th Percentile Ranks Actually Mean
- Where Percentile Rank Falls Short
- When to Rely on Percentile Rank, and When to Use Something Else
- How Testuno Reports Percentile Benchmarking
- What Teachers and Parents Get Wrong About Percentile Scores
- See Your Own Percentile Ranking in About 15 Minutes
- Sources
- FAQ
Percentile Rank Meaning vs. Percentile and Percent-Correct
The three terms people mix up constantly, once you separate them, actually make a lot of sense.
Percentile rank is a rank. It starts with someone's raw score and asks: what share of the norm group falls at or below that score? Percentile rank, formally, is a data point's position within an ordered set, so scoring in the 75th percentile means you scored as high as or higher than 75% of test takers.
A percentile works the opposite direction. It starts with a percentage and asks: what score sits at that threshold? The technical distinction is that percentile rank moves from score to percentage, while a percentile moves from percentage to score. Say "the 90th percentile score on this exam is 128" and you're naming a percentile. Say "your score of 128 puts you at the 90th percentile rank" and you're naming a rank.
Percent-correct is a different animal entirely, an absolute measure with no comparison group involved:
- Percentile rank: relative standing against other test takers
- Percentile: the score value that marks a given threshold
- Percent-correct: raw accuracy, no comparison to anyone else
A student can answer 60% of questions correctly and still land in the 85th percentile rank if the test was hard enough that most people scored lower. Confusing the two is one of the most common misreads on a score report, and education-focused explainers regularly flag this exact mix-up among students.
How to Calculate Percentile Rank Step by Step
The standard formula used in most testing reports applies a midpoint correction for tied scores:
PR = (CF − 0.5 × F) / N × 100
An alternate but equivalent version appears in some textbooks as CF′ + 0.5F, where CF′ is the cumulative frequency below the score.
Here's what each term means:
- CF (cumulative frequency): the count of scores at or below the score in question
- F (frequency): how many people got that exact score
- N (sample size): the total number of people in the comparison group
Why the 0.5 × F adjustment? Standardized tests produce lots of repeated integer scores, and treating every tied score as automatically "above" or "below" the others would be arbitrary. The midpoint method splits that difference, giving tied scores a fair, consistent position rather than an inflated or deflated one.
A note on software: Not every calculator or statistics package uses the midpoint approach. Some rely on cumulative distribution function (CDF) methods that produce slightly different results near the tails of a distribution. Different computational definitions exist, and educators writing about scores should specify which method a report uses to avoid readers comparing numbers that were never meant to line up.
What 95th, 75th, and 70th Percentile Ranks Actually Mean
Numbers on a page rarely convey what they represent, so a few translations help.
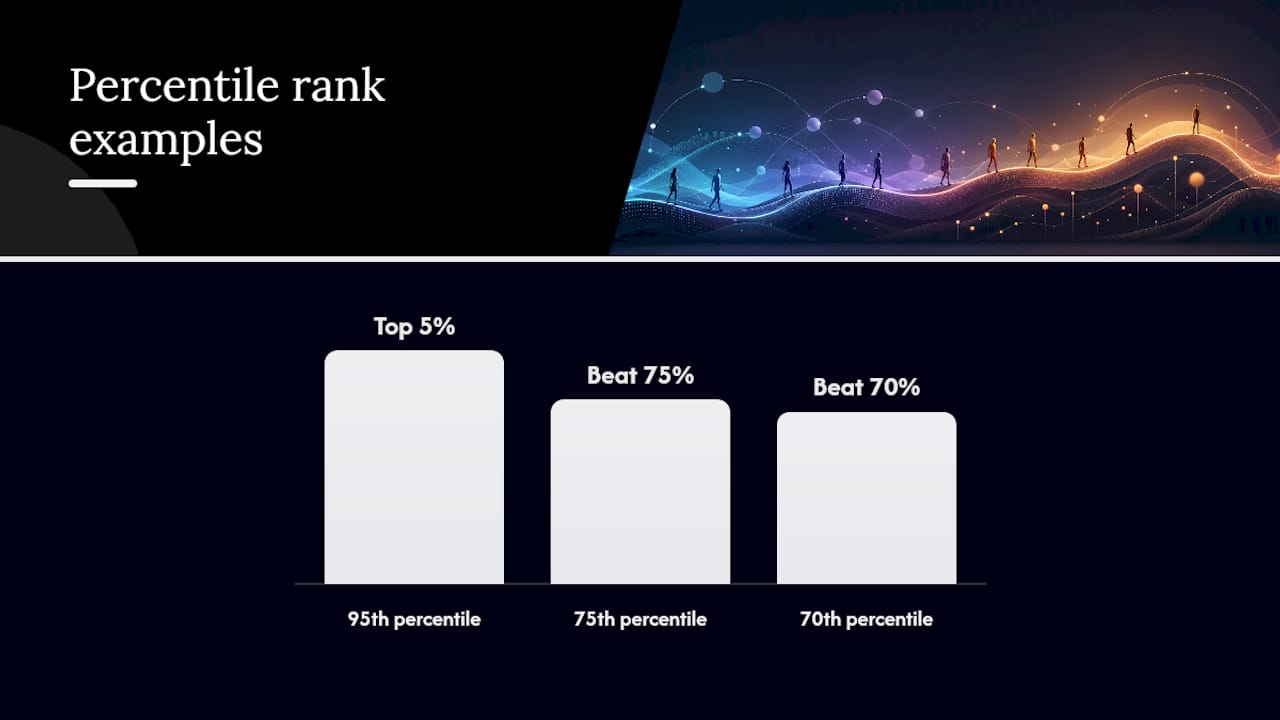
A percentile rank of 95 means the test taker performed as well as or better than 95% of the comparison group, with only 5% scoring higher. That puts someone in roughly the top 5% of test takers.
A 75th percentile rank means outperforming or tying about three out of every four people in the group. In a classroom of 32 students, that's somewhere around the top eight. A 70th percentile rank shifts that slightly, roughly the top 10 in the same class, still solidly above the midpoint but with more company nearby.
- 95th percentile: top 5% of the norm group
- 75th percentile: outperformed about 75% of peers
- 70th percentile: outperformed about 70% of peers, near the upper third
Here's a tie-handling illustration: if five students out of 100 tie at a raw score of 42, and 60 students scored below 42, the midpoint formula treats those five as occupying the middle of their own tied block rather than all landing at the same rank. Each gets credited with roughly half their own group's frequency added to the count below them.
Score reports often add a confidence range around a percentile rank, since measurement error and discrete scoring make a single-point number less precise than it looks. A reported 75th percentile might really mean "somewhere between the 68th and 82nd," depending on the test's standard error.
Pro Tip: When you see a percentile rank on a report, look for a companion range or confidence band before treating the single number as exact. If the report doesn't include one, ask the test provider whether the score has a published standard error.
Where Percentile Rank Falls Short
A percentile rank tells you where someone stands, not how they perform in absolute terms, and that distinction trips up a lot of readers.
- It's not percent-correct. Two students with wildly different accuracy rates can share the same percentile rank if the test difficulty or comparison group shifts.
- It's not an equal-interval scale. Because score distributions cluster densely near the middle of a bell curve, the gap between the 50th and 60th percentile represents a much smaller raw-score difference than the gap between the 90th and 99th.
- It's a weak solo metric for tracking growth. A student's raw score can climb while percentile rank holds steady or even drops, if the norm group's overall performance rises at the same time.
- Ties and discrete score ranges add noise. Whenever a confidence range is published alongside the rank, treat that range as the more honest number.
When to Rely on Percentile Rank, and When to Use Something Else
Percentile rank earns its keep in specific situations and falls flat in others.
- Use it to communicate relative standing. It's the clearest way to tell a parent or student how a score compares to a defined peer group, without requiring them to understand raw scoring scales.
- Skip it for growth tracking. Scaled scores or standard scores hold their meaning across test administrations better, since they aren't tied to a moving comparison group. A student's improvement over a year shows up more reliably on a scaled score than on a percentile rank alone, an issue that also comes up when comparing academic metrics like the GPA and MCAT grids used in medical school admissions, where relative standing and raw performance tell different stories.
- Pair it with other data for real decisions. Combine percentile rank with raw scores, subtest breakdowns, and any published confidence interval before making a placement or intervention call.
How Testuno Reports Percentile Benchmarking
Online self-assessment platforms handle percentile reporting differently, and it's worth knowing what a good report includes.
Testuno's flagship IQ test reports an estimated score alongside percentile benchmarking, so results show not just a number but where that number sits against other test takers. The platform breaks results down by subtest rather than collapsing everything into a single figure, which lines up with the "combine percentile with subtest breakdowns" guidance above.
- Instant feedback after roughly 15 minutes, no sign-up required
- Percentile benchmarking shown alongside the estimated score, not as a standalone figure
- Subtest-level detail rather than one composite number
- Downloadable reports for readers who want a saved record
What Teachers and Parents Get Wrong About Percentile Scores
Percentile ranks get treated like report cards when they're really more like a compass reading. Numbers invite ranking, and once a score report shows "62nd percentile," it's tempting to file a kid mentally under that label. That's a mistake the data itself argues against, since the same raw performance can shift several percentile points depending on which comparison group gets used that year.
Use percentile rank as one input, not the deciding vote. Set goals around raw score movement and subtest patterns, and treat the percentile as context for a conversation, not the conversation itself. Reports that show the raw score, the percentile rank, and a confidence range side by side give a far more honest picture than the percentile alone ever could.
— Steve
See Your Own Percentile Ranking in About 15 Minutes
Reading about percentile rank is one thing. Seeing your own land somewhere on that curve is another. Testuno's quick IQ test runs through six subtests and hands back an estimated score with percentile benchmarking attached, no sign-up wall between you and your results.

The report breaks performance down by subtest instead of flattening everything into one number, so you can see exactly where a percentile rank is coming from rather than taking it on faith. If you want the fuller picture, the complete IQ test adds more detail per subtest and a downloadable report you can keep. Either way, it takes about 15 minutes, and you'll walk away with a percentile figure you actually understand instead of one you have to take someone else's word for.
Sources
- Percentile rank — Wikipedia
- What is a percentile rank? — NWEA Connection
- Percentiles: Interpretations and Calculations — Statistics By Jim
- Percentiles — Statistics Fundamentals
FAQ
What does a 95th percentile rank mean?
It means the test taker scored as well as or better than 95% of the comparison group, placing them in the top 5% overall.
What does a 75th percentile rank mean?
A 75th percentile rank means the score matched or beat about 75% of the norm group, roughly the top quarter of test takers.
What is a good percentile rank score?
There's no single universal threshold, since context and the comparison group matter, but many educational settings treat scores at or above the 60th percentile as above average.
Is percentile rank the same as percent-correct?
No. Percentile rank measures relative standing against a comparison group, while percent-correct measures raw accuracy on the test itself, and the two numbers can differ substantially.