

Yes, faster reaction times tend to accompany higher IQ, but the relationship depends heavily on which kind of reaction time you're measuring. Simple reaction time correlates with intelligence at a modest negative level, while choice reaction time tends to show a stronger negative correlation. Population cohort studies and decades of meta-analytic work back this pattern, though reaction time is only one marker among several. Testuno treats it as one data point in a broader cognitive picture, not a verdict on its own.
TL;DR:
- Choice reaction time shows a stronger negative correlation with IQ, reaching up to -0.53 in older cohorts, making it a more valid cognitive proxy than simple reaction time.
- Reaction time correlations with intelligence are stronger in population samples than in restricted groups like students, due to range restriction effects.
- Variability in reaction times is less useful for individual assessments unless trial counts are high, as it strongly correlates with mean response times.
- Proper testing requires standardized input devices, enough trials, and control of factors like fatigue or device latency to ensure reliable results.
- Combining reaction time with reasoning and working memory tests offers a fuller, more accurate picture of cognitive abilities than reaction time alone.
Table of Contents
- What Does the Research Say About Reaction Time and IQ?
- What Do Simple RT, Choice RT, and Inspection Time Actually Measure?
- Why Are Faster Brains Linked to Higher IQ?
- What Limits How Much RT Data Can Tell You?
- How Do You Run a Reliable Reaction Time Test?
- What Can Reaction Time Actually Tell You About Intelligence?
- Why a Multi-Domain Cognitive Profile Beats a Single RT Score
- A Grounded Take on Reaction Time and IQ
- Test Your Own Reaction Time and Cognitive Profile
- Sources
What Does the Research Say About Reaction Time and IQ?
The numbers are more consistent than most people expect. Across large population samples, faster responders score higher on intelligence measures, and the relationship holds up whether researchers test teenagers, working adults, or retirees.
The clearest benchmark comes from a population-based cohort study of 900 adults around age 56, which found simple reaction time correlated with psychometric intelligence at about .31, while four-choice reaction time reached .49. That's a meaningful jump. Simple RT just measures how fast someone can respond to a single stimulus, usually by pressing one button when a light appears. Choice RT adds a decision layer: multiple possible stimuli, multiple possible responses, and a brain that has to sort out which one applies before acting. That extra step seems to tap into something closer to general processing efficiency.
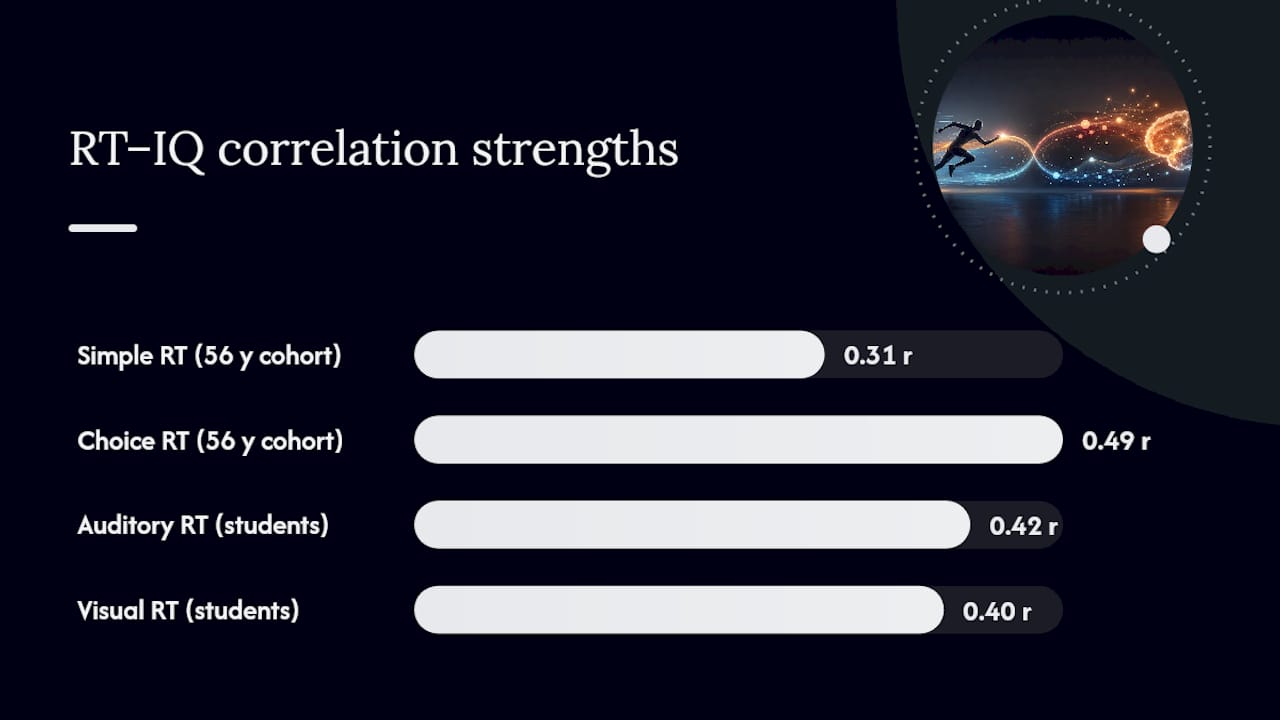
A separate analysis of three narrow age cohorts at 30, 50, and 69 years old found the pattern gets stronger with age. Simple RT correlations landed around −0.27 to −0.32, and four-choice RT correlations ranged from −0.44 to −0.53, with the relationship generally tightening in older cohorts. That age gradient matters for anyone trying to interpret a single test score: a 25-year-old and a 65-year-old with identical reaction times don't necessarily carry the same cognitive implications.
Zooming out further, a review spanning 172 studies and more than 53,000 participants found the negative correlation between processing speed and intelligence holds up consistently, with more complex speeded tasks producing stronger associations than the simplest ones. That's the closest thing this field has to a settled consensus.
The core numbers: Simple RT correlates with IQ around −0.20 to −0.32. Choice RT correlates around −0.30 to −0.50, sometimes approaching −0.53 in older cohorts. Neither figure implies reaction time causes intelligence, or vice versa.
Reaction time also connects to outcomes outside the lab, which is why understanding exam simulation benefits can help students improve their cognitive performance under testing conditions. A study of 700 undergraduates found visual and auditory reaction times both showed moderate negative correlations with academic performance, with auditory RT at −0.42 and visual RT at −0.40. Students who responded faster to simple stimuli tended to perform better academically, though the relationship explained only part of the variance in grades. Plenty of slow responders were excellent students, and plenty of fast responders weren't.
A few patterns show up repeatedly across these studies:
- Choice RT beats simple RT as a predictor of general intelligence in nearly every dataset examined.
- Correlations tend to strengthen with age, likely because processing speed declines faster in some individuals than others as neural efficiency changes over decades.
- Sample composition matters enormously. A sample restricted to university students will show weaker RT-IQ correlations than a full population sample, simply because the IQ range is compressed.
- Complex RT tasks relate to more components of overall cognitive function than simple tasks do, according to clinical validation research comparing healthy subjects and patients.
That last point is worth sitting with. If you test a group of people who already cleared a competitive admissions bar, you're going to see a smaller spread in both IQ and RT than if you tested a random sample of the general population. Restricted range shrinks correlations without changing the underlying relationship. This is one reason lab results using undergraduate samples sometimes look weaker than population-representative cohort studies. It's not that the relationship disappears. It's that everyone in the sample already sits near the high end of the ability curve.
What Do Simple RT, Choice RT, and Inspection Time Actually Measure?
Not all reaction time tasks measure the same thing, and mixing them up is one of the most common mistakes in casual self-testing.
Simple reaction time (SRT) asks for one response to one stimulus. Watch for a flash, press a button. It's the least cognitively demanding task in this category, largely reflecting sensory processing speed and basic motor execution rather than higher-order thinking. That's why its correlation with IQ sits at the lower end of the range.
Choice reaction time (CRT) introduces a decision. Two or more stimuli, each requiring a different response. This forces the brain to discriminate between options before acting, which recruits more of the machinery associated with general cognitive ability. A population-based cohort study found four-choice RT correlated with intelligence at nearly double the strength of simple RT in the same sample, which is the single clearest argument for why choice tasks matter more for cognitive inference.
Inspection time measures how briefly a visual stimulus can be presented while a person still identifies it correctly. It strips away the motor response entirely, isolating the speed of early perceptual processing. Because it removes decision and action components, some researchers consider it a cleaner index of raw processing speed, though it requires more careful equipment calibration than a basic RT test.
Variability measures (sometimes called intra-individual variability or IIV) track how consistent a person's response times are across trials, not just their average speed. This one is trickier than it looks. Variability correlates strongly with mean RT itself, at roughly r = 0.47 to 0.58, which means raw variability scores are partly just restating the average. Researchers have to residualize variability against the mean before treating it as an independent predictor.
For personal testing or a small classroom study, here's how these stack up:
- Simple RT is the easiest to administer and requires no training, but it's the weakest cognitive proxy of the group.
- Choice RT takes slightly longer to explain and run, but delivers a meaningfully stronger signal per minute of testing time.
- Inspection time demands more precise timing control and isn't well suited to casual browser-based testing.
- Variability measures need larger trial counts and statistical adjustment, making them impractical outside a formal study.
Pro Tip: If you only have time for one type of test, pick choice reaction time over simple RT. It takes barely longer to complete and gives you a far more informative number for thinking about cognitive speed.
Why Are Faster Brains Linked to Higher IQ?
The leading explanation is the information-processing account: intelligence partly reflects how efficiently a nervous system can take in a stimulus, process it, and produce a response. Under this view, reaction time isn't just correlated with IQ by coincidence. It's a behavioral readout of the same underlying neural efficiency that shows up on paper-and-pencil reasoning tests.
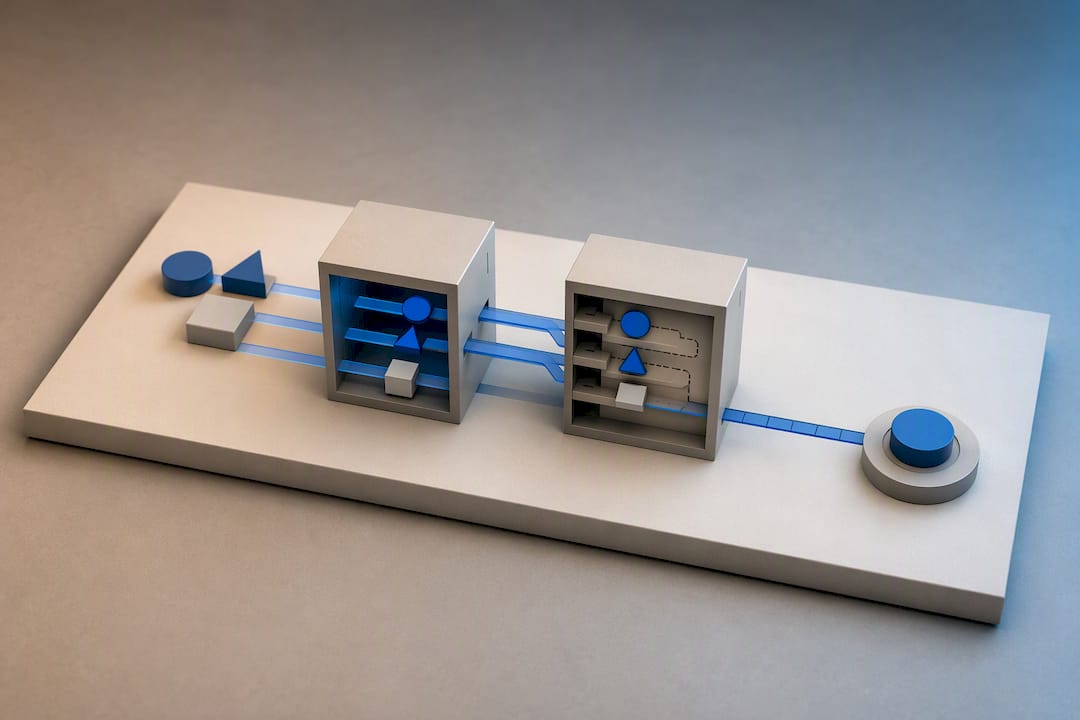
Supporting evidence comes from several directions. Neurophysiological work on event-related potentials, particularly the P3b component, has linked faster neural signal latencies to higher scores on cognitive tests, suggesting the speed advantage starts at the level of brain signal transmission rather than muscle response. Inspection-time research points the same direction: even when motor speed is removed from the equation entirely, faster perceptual identification still tracks with higher intelligence scores.
None of this settles the mechanism definitively. A few things temper the story:
- The relationship is probabilistic, not deterministic. Plenty of individuals with slower reaction times score well above average on IQ tests, and the reverse happens too.
- Processing speed is likely one contributor among several, alongside working memory capacity, attentional control, and strategy use.
- Some researchers argue the RT-IQ link partly reflects shared reliance on sustained attention and task engagement rather than pure neural transmission speed.
- Methodological reviews caution against reverse inference, meaning you can't assume a specific brain process just because a task produced a certain RT pattern, and they recommend model-based analyses like diffusion models to separate decision time from other components.
The honest summary: neural efficiency is a plausible and partially supported explanation, not a proven, singular cause. Intelligence researchers generally treat processing speed as one thread in a multi-causal rope, not the whole rope.
What Limits How Much RT Data Can Tell You?
Reaction time testing looks simple on the surface. Press a button when you see a signal. But several factors can distort what that number actually means, and skipping past them is how people end up overinterpreting a single test session.
- Speed-accuracy tradeoff. Some people respond quickly but make more errors; others respond slowly but stay accurate. Comparing raw RT without accounting for accuracy can make a careless fast responder look sharper than a careful slow one. Researchers increasingly favor diffusion models that separate decision speed from caution as a strategy.
- Age mixing inflates correlations. Combining a wide age range in one sample can artificially strengthen the apparent RT-IQ relationship, since both processing speed and fluid intelligence decline with age on parallel tracks. Studies that stratify by narrow age bands, like the three-cohort analysis at ages 30, 50, and 69, give a more honest picture of the effect at any single life stage.
- State factors swamp trait differences. Fatigue, caffeine, stress, and simple boredom with a repetitive task can shift RT scores by amounts larger than the true individual differences researchers are trying to detect.
- Device and browser latency add noise. A laptop trackpad, a phone touchscreen, and a mechanical keyboard all introduce different input lag, which can swing measured RT by tens of milliseconds unrelated to cognition.
Pro Tip: Run any RT test at the same time of day, on the same device, after the same amount of sleep, if you want to compare your own scores across sessions. Otherwise you're measuring your coffee intake as much as your cognition.
How Do You Run a Reliable Reaction Time Test?
Getting a usable RT number takes more discipline than most people assume. A single rushed attempt tells you almost nothing. Here's what actually improves data quality, whether you're testing yourself out of curiosity or running a small classroom project.
Before you start:
- Use a consistent device and input method across every session; a mouse click and a touchscreen tap don't produce comparable latencies.
- Test in a quiet environment with the screen at a normal viewing distance and consistent lighting.
- Run five to ten warm-up trials that don't count toward the final score, so the first few clumsy responses don't drag down your average.
- Get a full night's sleep beforehand. Sleep deprivation alone can slow reaction time by amounts comparable to real cognitive differences between individuals.
Choosing the task:
Favor a multi-choice reaction time format over the simplest single-button click test if your goal is drawing any conclusion about cognitive ability. The choice-RT format recruits decision-making processes that correlate more strongly with general intelligence, giving you a more informative number for the same amount of testing time.
Collecting enough data:
- Run at least 40 to 100 trials in a single session; fewer than that produces an unstable average that swings wildly between attempts.
- Discard anticipatory responses, meaning any reaction faster than roughly 100 to 150 milliseconds, since these usually reflect guessing rather than genuine perception.
- Trim or winsorize extreme outliers rather than deleting them outright, since RT distributions are naturally skewed toward slower values with an occasional very slow tail.
- Report both the median and a trimmed mean alongside standard deviation, since RT data rarely follows a clean bell curve and the mean alone can mislead.
- Document your device, browser, and input method every time, so you can tell a genuine change in your scores from a change in your hardware.
A useful benchmark: In a 900-person sample around age 56, four-choice RT correlated with intelligence at .49, nearly double the .31 correlation seen for simple RT in the same cohort. That gap is the strongest argument for choosing a choice-based task over a single-click test.
Interpreting your own numbers responsibly:
Compare your results to population norms only in general terms, and treat your own trajectory over multiple sessions as more meaningful than any single score against a stranger's average. A processing speed assessment that reports percentile context alongside raw milliseconds gives you a more honest anchor than a bare number with nothing to compare it to.
What Can Reaction Time Actually Tell You About Intelligence?
A reaction time score is informative, not diagnostic. It's a genuine, replicated correlate of intelligence, but it explains only part of the variance in IQ scores, not the majority of it. Even the strongest choice-RT correlations, hovering near −0.50, mean processing speed accounts for roughly a quarter of the variation in intelligence scores across a population. The rest comes from other factors entirely.
Some reasonable inferences and some common misreads worth separating:
- Reasonable: a consistently fast choice-RT score suggests efficient processing speed, one component that tends to support higher fluid reasoning.
- Reasonable: a notably slow RT paired with fatigue or poor sleep the night before probably reflects state, not stable trait ability.
- Misread: treating a single fast RT session as proof of exceptional intelligence. Plenty of high-IQ individuals post middling reaction times.
- Misread: treating a slow RT score as evidence of cognitive decline or low ability without considering age, practice effects, or testing conditions.
The most useful approach combines reaction time with measures of reasoning and working memory rather than relying on speed alone. Pairing an abstract reasoning test with an RT measure gives you a fuller picture than either one in isolation, since reasoning captures problem-solving capacity that speed alone can't touch.
Why a Multi-Domain Cognitive Profile Beats a Single RT Score
A single reaction time number is a snapshot, not a portrait. Intelligence researchers have known for decades that no single task, however well validated, captures the full range of what people mean by cognitive ability. Processing speed, working memory, verbal reasoning, and spatial reasoning each contribute distinct, only partially overlapping information.
That's the logic behind testing across domains instead of leaning on one metric. A person with average reaction time but strong verbal reasoning has a very different cognitive profile than someone with fast RT but weak working memory, even if a single RT test would rank them similarly. Testuno structures its flagship IQ assessment around six research-grounded subtests specifically to avoid the trap of judging cognitive ability from one narrow slice of performance.
A few reasons multi-domain testing holds up better than single-metric inference:
- It reduces the risk of a bad day, a laggy device, or low motivation skewing your entire cognitive picture.
- It captures abilities, like verbal reasoning or spatial visualization, that reaction time simply doesn't measure.
- It provides percentile context across several dimensions at once, so a weak score in one area doesn't get mistaken for a global weakness.
- It mirrors how professional cognitive assessments are actually built, combining speed, reasoning, and memory rather than any single task.
A Grounded Take on Reaction Time and IQ
The correlation between reaction time and IQ is real, replicated, and worth taking seriously. It's also smaller than a lot of casual online discussion suggests, and choice reaction time carries far more signal than the simple click-test format most people associate with "reaction time" in the first place.
My practical recommendation: if you want to learn something genuine about your own cognitive speed, run a structured choice-RT test under controlled conditions, more than once, and pair it with a reasoning measure. Track your own numbers over time rather than chasing a single impressive session. A cognitive profile that blends processing speed with reasoning and memory will tell you far more than any reaction-time score standing alone, no matter how fast it is.
If you're curious where you land, running a structured cognitive assessment that includes reaction time alongside reasoning gives you a more complete answer than any single-task app ever will.
— Steve
Test Your Own Reaction Time and Cognitive Profile
Reading about correlation coefficients only gets you so far. If you want to see where your own processing speed and reasoning ability actually land, running a structured self-assessment beats guessing from a single reflex-test app.
Testuno's reaction time test measures choice-based responses under consistent conditions, then places your score in percentile context instead of handing you a bare number with no frame of reference. Pair it with the quick IQ test to see how your processing speed lines up against reasoning ability in the same sitting. Both can take about 15 minutes and may give instant benchmarking against population norms, with a detailed report sometimes available for keeping results or digging into subtest-level performance. Start with the reaction time test, then move straight into the full IQ assessment to see how the two pieces fit together.
Sources
- The relationship between intelligence and reaction time varies with age: Results from three representative narrow-age age cohorts at 30, 50 and 69 years
- On the Need to Improve the Way Individual Differences in Cognitive Function Are Measured With Reaction Time Tasks
- Reaction times and intelligence differences: A population-based cohort study
- Validation of reaction time as a measure of cognitive function and quality of life in healthy subjects and patients