

The speed-accuracy tradeoff (SAT) is the tendency for faster decisions to be less accurate, because less evidence gets accumulated before the brain commits to a choice. Sequential sampling models, especially the drift-diffusion model, explain this by treating decisions as a race to a threshold of accumulated evidence. The Frontiers in Neuroscience review by Heitz documents SAT across nearly every species and task type ever tested, which is why it matters to anyone measuring cognition, from lab researchers to a platform like Testuno running quick online assessments.
TL;DR:
- Slowing down training or tasks can lead to significant gains in both speed and accuracy through practice and better design.
- Manipulating payoff structures or incentives can shift boundary separation, improving overall performance rather than just trading speed for accuracy.
- Cross-species evidence indicates the speed-accuracy tradeoff is a universal constraint, not limited to humans or specific tasks.
- Neural activity in the striatum and pre-SMA reliably correlates with boundary adjustments, but causality remains unconfirmed.
- Research designs must carefully match manipulations to the targeted decision process and ensure sufficient trial data for accurate parameter estimation.
Table of Contents
- What Does the Speed-Accuracy Relationship Look Like in Real Tasks?
- How Did the Speed-Accuracy Tradeoff Enter Decision Science?
- What Do Drift-Diffusion Models Say About Speed and Accuracy?
- How Should Researchers Manipulate and Measure the Speed-Accuracy Tradeoff?
- What Brain Mechanisms Underlie the Speed-Accuracy Tradeoff?
- What Factors Shift Someone's Speed-Accuracy Balance?
- What Should Researchers Watch for When Designing SAT Experiments?
- How Does SAT Show Up Outside the Laboratory?
- How Testuno's Speed and Accuracy Tests Relate to SAT Research
- An Editorial Take on Where SAT Research Should Go Next
- Try Testuno's Speed and Accuracy Assessments
- Sources
- FAQ
What Does the Speed-Accuracy Relationship Look Like in Real Tasks?
Slow down, and you get more of the answer right. Speed up, and you get more of it wrong. That basic inverse relationship shows up in nearly every task where a decision has to be made under time pressure, and it is remarkably stable across contexts that otherwise look nothing alike.
The clearest laboratory demonstration comes from random-dot motion tasks, where a screen of moving dots contains a faint directional signal buried in noise, and a person has to decide left or right. Give someone unlimited time and they will nail the direction close to perfectly. Force a decision within 300 milliseconds and accuracy drops toward chance. The task strips away everything except the core mechanism: evidence has to build up over time, and cutting that time short cuts into accuracy.
The same pattern governs two-alternative forced-choice tasks generally, whether the choice is between two tones, two shapes, or two words flashed briefly on a screen. It also governs tasks that look nothing like a lab experiment.
- Aiming and reaching movements: Fitts's Law formalizes how movement time increases as a target gets smaller or farther away, because hitting a precise target under time pressure forces a tradeoff between velocity and accuracy.
- Speeded reading versus careful proofreading: skimming a document catches the gist but misses typos; reading slowly for errors catches nearly everything but takes far longer.
- Typing and data entry: pushing words-per-minute up without practice reliably increases error rate, which is part of why typing-speed platforms track both metrics rather than speed alone.
Cross-species evidence makes the case that this is not a quirk of human psychology. Heitz's review catalogs the tradeoff in insects making foraging decisions, rodents navigating mazes, and primates performing perceptual discrimination tasks in controlled trials. The consistency across such different nervous systems suggests SAT reflects something close to a universal constraint on how evidence-based decisions get made, not a human habit or a product of culture.
How Did the Speed-Accuracy Tradeoff Enter Decision Science?
The tradeoff had informal recognition for decades before it became a formal research tool. Paul Fitts's 1954 work on movement and target acquisition gave the field its first quantitative law linking speed and precision, and it remains one of the most replicated findings in experimental psychology.
The bigger shift came when researchers realized they could manipulate SAT directly using payoff matrices, rewarding correct fast responses more than correct slow ones, or penalizing errors heavily, and use the resulting shifts to test theories of decision-making. Robert Pachella's methodological critiques in the 1970s pushed the field to stop treating reaction time and accuracy as separate, independent measures. He argued that any theory of cognitive processing had to account for both simultaneously, or it was not really a theory of decision-making at all.
Wayne Wickelgren's later work on strength theory and diffusion-style models gave the field its first serious mathematical account of how a criterion shift produces the RT and accuracy patterns observed in the lab. That lineage is why SAT became a benchmark phenomenon: any new computational model of decision-making has to reproduce it, or it gets rejected as incomplete. A model that predicts accuracy but not the accompanying reaction time distribution, or vice versa, fails a test that has been standard since the 1970s.
This history matters for how modern researchers read the literature. When a paper claims a new intervention "improves accuracy," the immediate question decision scientists ask is whether it also slowed responses down. Without that check, an apparent improvement might just be a criterion shift dressed up as genuine gain.
What Do Drift-Diffusion Models Say About Speed and Accuracy?
Picture a boat drifting on a river toward one of two banks. Noise in the current pushes it randomly side to side, but a steady current, the drift, pulls it toward the correct bank on average. The boat has reached a decision the moment it touches either shore. That is the drift-diffusion model (DDM) in a sentence: evidence accumulates noisily over time until it crosses a threshold, and the choice made corresponds to whichever threshold gets hit first.
Three parameters do almost all the explanatory work in the model, and each maps onto a distinct cognitive process.
- Drift rate (v): how quickly evidence accumulates toward the correct answer, reflecting the quality of the underlying information or the person's sensitivity to it.
- Boundary separation (a): how much evidence is required before committing, reflecting the person's caution or their strategic emphasis on speed versus accuracy.
- Non-decision time (t0): the fixed time spent on perceptual encoding and motor execution that has nothing to do with the decision itself.
Pro Tip: If two conditions produce the same accuracy but different reaction times, don't assume the underlying decision process changed. Fit a DDM first. Often the difference lives entirely in non-decision time, meaning the actual decision mechanism was identical and only the encoding or motor stage shifted.
Boundary separation is the parameter that directly encodes SAT. Widen the boundary and a person needs more accumulated evidence before responding, which produces slower but more accurate choices. Narrow it and responses come faster but with a higher error rate, because noisy, incomplete evidence gets accepted as sufficient more often. This single parameter, more than drift rate or non-decision time, is what shifts when someone consciously decides to "go faster" or "be more careful."
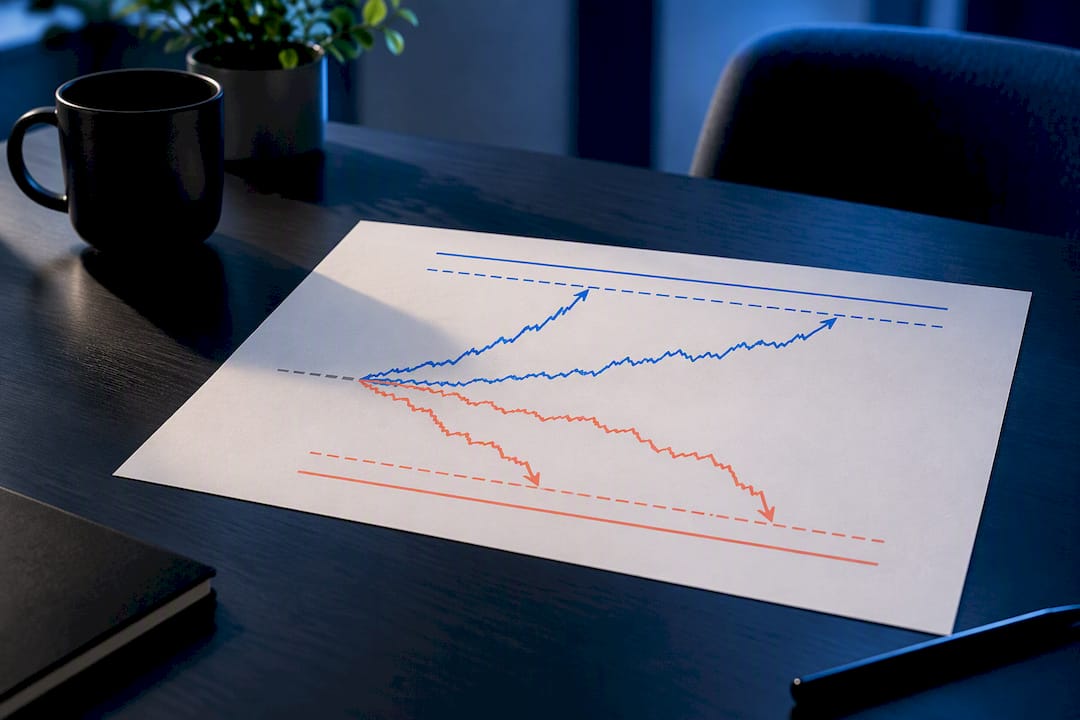
Collapsing bounds add a wrinkle that fixed-boundary models miss. Instead of a constant threshold, the boundary narrows as time passes within a trial, so evidence that would have been rejected early in the decision gets accepted later on. This produces a specific behavioral signature: accuracy on the slowest responses in a condition drops toward chance, because those late responses are essentially being forced through a shrinking gate rather than reflecting confidently accumulated evidence. The Springer methodological analysis treats this distinction as central to correctly interpreting SAT manipulations, since a collapsing-bound signature implies a very different underlying strategy than a simple fixed-threshold shift.
Sequential sampling models remain the dominant explanatory framework in the field precisely because they predict full reaction time distributions, not just mean RT and accuracy, and those distributional predictions have held up across decades of testing according to the Heitz review. That predictive reach is why fitting a DDM tells a researcher more about the latent decision process than comparing raw accuracy or raw RT ever could on their own.
How Should Researchers Manipulate and Measure the Speed-Accuracy Tradeoff?
Not every manipulation that changes speed and accuracy touches the same underlying mechanism. Getting this wrong is one of the most common design mistakes in SAT research, and it can lead to a fitted model that looks reasonable but describes the wrong cognitive process entirely.
- Verbal instructions ("respond as fast as possible" versus "respond as accurately as possible") typically produce a clean, stable shift in boundary separation, holding drift rate roughly constant across the instructed conditions.
- Payoff matrices that reward speed or accuracy differentially work similarly to instructions but give the researcher a quantifiable lever, useful for mapping out multiple points along the same SAT curve within one participant.
- Response deadlines are riskier because they often induce collapsing bounds rather than a simple fixed shift, especially as the deadline approaches within a trial, per the Springer analysis of SAT manipulations.
- Response-signal methods, where a cue partway through the trial tells the participant to respond immediately with whatever evidence has accumulated so far, let researchers sample the accumulation process at controlled time points rather than inferring it after the fact.
Once data is collected, three summary plots do most of the reporting work in the field, and each answers a different question.
The SAT function (SATF) plots mean accuracy against mean reaction time across conditions, giving the simplest visual summary of the tradeoff curve itself. It is the plot to lead with in any paper, but it hides distributional detail.
The conditional accuracy function (CAF) bins responses by reaction time and plots accuracy within each bin, revealing whether accuracy stays flat, declines, or even dips and recovers as responses get slower. A CAF that dips at moderate RTs and then recovers at slow RTs is a classic signature of fast guesses contaminating the middle of the distribution.
The quantile probability plot (QPP) goes further still, linking specific RT quantiles (the 10th, 30th, 50th, 70th, 90th percentile, for instance) to response probability for both correct and error responses. The Heitz review notes that QPPs demand considerably larger trial counts than SATF or CAF plots, because quantile estimates get noisy fast with sparse data, particularly for the error distribution when error rates are already low.
Pro Tip: Before running a full QPP analysis, check your error trial count per condition. If you have fewer than roughly 20 to 30 error trials per cell, your quantile estimates for the error distribution will be too noisy to trust, no matter how clean your correct-trial data looks.
What Brain Mechanisms Underlie the Speed-Accuracy Tradeoff?
A specific cortical and subcortical circuit shows up again and again in imaging work tied to SAT. Activity in the striatum and pre-supplementary motor area (pre-SMA) tracks boundary separation adjustments directly, rising when a person adopts a cautious, evidence-heavy strategy and easing when they shift toward speed, a pattern documented in fMRI work summarized on the ScienceDirect topic overview of SAT. Lateral prefrontal cortex activity shifts in a complementary direction consistent with active threshold reduction when speed is emphasized.
EEG work adds a temporal layer to that picture that fMRI cannot provide on its own.
- Alpha-band suppression tends to accompany states of faster evidence integration, and elevated baseline cortical activity can speed that integration process at some cost to discriminability, a tradeoff detailed in neural oscillation research on speeded states.
- This offers a plausible physiological account for why fast responding is inherently noisier: the same neural state that speeds integration also degrades the signal-to-noise ratio of the evidence being integrated.
- Single-unit recordings in non-human primates performing speeded choice tasks show firing-rate changes in decision-related neurons that track threshold adjustments directly, giving the clearest causal-adjacent evidence that boundary separation has a genuine neural substrate rather than being a purely descriptive model parameter.
None of this evidence is airtight causal proof. Most of the imaging and EEG findings are correlational: activity co-varies with instructed strategy, but that does not by itself prove the activity causes the boundary shift rather than merely reflecting it downstream. Single-unit work gets closer to a causal account because it can be paired with stimulation studies, but even there, open questions remain about how well findings from trained primates performing thousands of trials generalize to a person doing a novel task for the first time. Treat neural SAT findings as a strong, converging correlational picture rather than a settled mechanism.
What Factors Shift Someone's Speed-Accuracy Balance?
SAT is not a fixed trait. It moves in response to motivation, physical state, practice, and age, and understanding which factor is doing the moving matters for interpreting any given result correctly.
Reward and payoff structure is the most direct lever. Sweetening the reward for correct responses does not just shift someone along the existing SAT curve, it can, in some conditions, improve overall performance rather than trading one metric for another, according to the ScienceDirect summary of speed-accuracy tradeoff research. That distinction matters when designing incentive structures for testing or training: a well-calibrated reward can push both speed and accuracy upward at once rather than forcing a choice between them.
Physical exercise produces one of the more striking findings in this space. A stair-climbing study found that participants who completed a bout of aerobic exercise showed a 20.6% reduction in response time on incongruent Stroop trials, a demanding executive-conflict task, compared to only an 8.1% reduction in a non-exercise control group, according to research on acute exercise and processing speed. Critically, this speed gain did not come paired with more errors, suggesting brief aerobic activity can shift the whole SAT curve outward rather than just sliding a person along it.
Aging tends to move the curve in the opposite direction. Older adults generally show slower processing speed alongside preserved or even improved accuracy relative to younger adults on many tasks, a pattern consistent with a more conservative decision criterion rather than a simple decline in raw processing capacity. Individual differences compound this: some people show a stable, trait-like preference for caution across many different tasks, while others default to speed, independent of any instructions given.
- Practice narrows reaction time variability and can shift the SAT curve favorably, but transfer to genuinely novel tasks is often weaker than trained-task gains suggest.
- Progressive training, gradually increasing task difficulty or speed demands rather than jumping straight to maximum difficulty, tends to produce more durable gains than fixed-difficulty repetition.
- Anyone using processing speed exercises to track improvement should expect gains on the trained task to outpace gains on related but different tasks.
What Should Researchers Watch for When Designing SAT Experiments?
Good SAT research starts with matching the manipulation to the question. If the goal is to test a strategic account of decision-making, instructions or payoffs are the cleaner choice, since they tend to produce stable boundary shifts. If the goal is to study time pressure itself, deadlines are appropriate, but the collapsing-bound risk has to be built into the modeling plan from the start rather than discovered after the fact.
- Plan trial counts around your weakest analysis, not your strongest. A QPP analysis with a reasonable error distribution typically needs several hundred trials per condition per participant; an SATF alone can work with far fewer.
- Fit models hierarchically across participants rather than participant by participant where sample size allows, since hierarchical Bayesian fits borrow statistical strength across the group and produce more stable parameter estimates than individual fits on sparse data.
- Run parameter recovery simulations before trusting a novel design. Generate synthetic data from known parameter values, fit the model to that synthetic data, and confirm the fitting procedure recovers something close to the true values before applying it to real participants.
- Report a fit-quality checklist alongside parameter estimates: predicted versus observed RT distributions, predicted versus observed accuracy, and any diagnostic plots like a QPP overlay.
Pro Tip: A drift-diffusion model can produce a statistically "good" fit while confusing boundary separation with drift rate, since the two parameters can trade off against each other in some designs. Always check parameter recovery before trusting your fitted values, not just after.
Three pitfalls account for a disproportionate share of flawed SAT conclusions. The first is conflating task difficulty with an actual SAT shift. If a harder task produces slower, less accurate responses, that alone does not prove a strategic criterion change happened. Drift rate probably dropped because the evidence itself got weaker, which is a different story from a boundary shift entirely.
The second is the low-error-rate problem: tasks designed to be easy often produce error rates too low to support a stable CAF or QPP, leaving accuracy analyses statistically underpowered even when reaction time data looks pristine. The third is overfitting a model with more free parameters than the data can constrain, a mistake parameter recovery testing catches before it wastes months of analysis.
How Does SAT Show Up Outside the Laboratory?
Exam design is a direct, practical application of SAT principles. Timed tests inherently force students toward a speed-emphasizing criterion, and research on exam strategy consistently flags time management as a controllable factor separate from raw content knowledge, a point covered well in this guide to time management on math exams. A student who understands they are choosing a point on a tradeoff curve, rather than simply "running out of time," can make more deliberate choices about which questions to slow down on.
Interface design faces a parallel challenge. A search function or a form-validation flow that responds instantly but frequently misfires trains people toward distrust just as surely as one that is accurate but sluggish trains them toward abandonment. Good HCI practice reports both speed and error rate together for any interaction, rather than optimizing one metric in isolation, since a fast interface with a high error rate often creates more total user time lost, through correction and rework, than a moderately slower but more reliable one.
Clinical assessment treats processing speed as informative in its own right, not merely as noise around an accuracy score. A person who solves problems at average accuracy but markedly reduced speed may be flagged for further evaluation even when their raw accuracy score alone would look unremarkable. This is precisely why processing speed gets measured separately from general reasoning ability in most standardized cognitive batteries, rather than folded into one composite score.
How Testuno's Speed and Accuracy Tests Relate to SAT Research
Testuno's reaction time and processing speed assessments measure the same basic quantities that decision scientists track in the lab: how fast someone responds and how often that response is correct, reported together with percentile benchmarking against other users. That instant, side-by-side reporting is genuinely useful for a quick self-check or for tracking whether practice is moving the needle over weeks.
What Testuno's tests are not is a substitute for a controlled lab paradigm. A 15-minute online session cannot fit a hierarchical drift-diffusion model, control for collapsing bounds, or isolate non-decision time from boundary separation. Researchers needing that level of parameter-level detail still need dedicated lab software and hundreds of trials per condition. For screening, curiosity, or informal progress tracking, though, a quick benchmark against a percentile distribution tells you plenty without demanding a research setup.
An Editorial Take on Where SAT Research Should Go Next
The biggest gap in this field is not theoretical. The models are mature and well-validated. The gap is translation: how well do lab-derived boundary-separation shifts predict real-world decisions made under genuine stakes, not a payoff matrix worth a few cents per trial? I would bet the answer varies more by domain than most researchers currently assume.
Neural implementation questions deserve more attention too, since most of the striatal and pre-SMA evidence remains correlational rather than causal. And training generalization is weaker than marketing around "brain training" implies. The honest, useful next step for this field is more preregistered replication and more transparent reporting of parameter recovery, not more novel paradigms chasing a new effect.
— Steve
Try Testuno's Speed and Accuracy Assessments
Lab-grade SAT research demands hundreds of trials, hierarchical model fits, and dedicated software, but most readers just want an honest snapshot of where they stand. This can be done in about 15 minutes, with instant percentile benchmarking and no sign-up wall standing between you and your results.

Start with the reaction time test if you want a fast baseline reading, or the processing speed test if you are tracking practice effects over several sessions. Both report speed and accuracy together rather than one number in isolation, which is the whole point of understanding your own tradeoff curve rather than guessing at it. If you want the fuller cognitive picture, Testuno's full catalog of brain and cognitive tests covers working memory and reaction time side by side. Pick a test, run it once now, and run it again in a few weeks to see whether your curve has actually shifted.
Sources
The foundational review for this entire topic is the Frontiers in Neuroscience paper by Heitz, covering history, physiology, methodology, and cross-species behavior in one comprehensive treatment. For manipulation-specific guidance, the Springer methodological analysis explains exactly how instructions, payoffs, and deadlines map onto different latent parameters. On the exercise-cognition link, the PMC study on acute aerobic exercise documents measurable speed gains without added errors. Related PMC literature on decision-making mechanisms offers additional grounding on the computational side.
- The speed-accuracy tradeoff: history, physiology, methodology, and behavior — Frontiers in Neuroscience (Heitz 2014)
- Methodological analysis of SAT manipulations — Springer (2020)
FAQ
Which Matters More, Speed or Accuracy?
Neither wins universally. It depends entirely on the task's cost structure: a medical diagnosis or a proofread legal document weighs accuracy heavily, while a time-limited exam or an emergency response weighs speed, and the Heitz review frames this as a strategic choice people make rather than a fixed rule.
Why Do People Say Accuracy Beats Speed?
Errors are often more expensive to fix than a slow response is to wait out, especially in high-stakes decisions like medical or safety judgments, so that framing shows up most in contexts where mistakes carry a real cost. In low-stakes, high-volume tasks like casual typing or browsing, the calculus often favors speed instead.
What Do Speed and Accuracy Actually Mean in This Context?
Speed refers to reaction time, how long it takes to commit to a response, while accuracy refers to whether that response was correct. The speed-accuracy tradeoff describes how pushing one of these up typically pulls the other down, because faster responses generally reflect less accumulated evidence before a decision gets made.
Can You Improve Both Processing Speed and Accuracy Together?
Yes, within limits. Practice, better task design, and even brief aerobic exercise have all been shown to shift the whole tradeoff curve outward rather than simply sliding a person along it, meaning both metrics can improve at once rather than trading against each other.
How Can I Check My Own Speed-Accuracy Balance?
A quick, structured self-check works well for casual tracking. Testuno's reaction time and processing speed tests report both metrics together with percentile benchmarking, though a full lab-based drift-diffusion analysis remains the more precise option for formal research purposes.